Spoiler: General/subsetup stats
| Setup | Wins | Losses | Winrate | Games |
|---|---|---|---|---|
| 1 (JK) | 40 | 35 | 53.3% | 75 |
| 2 (RB, Cop, Doc) | 45 | 38 | 54.2% | 83 |
| 3 (BP, Trk) | 34 | 48 | 41.5% | 82 |
| A (JK, RB, BP) | 31 | 48 | 39.2% | 79 |
| B (Cop) | 33 | 45 | 42.3% | 78 |
| C (Doc, Trk) | 34 | 42 | 44.7% | 76 |
| Total | 217 | 256 | 45.9% | 473 |

Spoiler: Result stats
Average player types per game: 5.5 Newbies, 2.5 SEs, 1.0 ICs

| Player | Win % | Total slots |
|---|---|---|
| Town Newbies | 46.1% | 2029 |
| Scum Newbies | 52.8% | 566 |
| Total Newbies | 47.6% | 2595 |
| Town SEs | 45.3% | 924 |
| Scum SEs | 57.0% | 265 |
| Total SEs | 47.9% | 1189 |
| Town ICs | 45.8% | 358 |
| Scum ICs | 53.9% | 115 |
| Total ICs | 47.8% | 473 |
| All town | 45.9% | 3311 |
| All scum | 54.1% | 946 |
| All players | 47.7% | 4257 |
Spoiler: Replacement stats
Notes:
If a slot is replaced twice, that counts as one replaced slot and two replaced players. Therefore, the player rate cannot be any lower than the slot rate. A slot rate of 100% means that all 9 slots were replaced at least once. A player rate of 100% means that 9 players (from any slots) were replaced (so it can exceed 100%). I don't know which type of rate is better to use, though using both is useful (it tells us whether all the replacements came from one slot or were distributed amongst multiple slots). (Reminder: The Matrix6 setup has 9 players, hence why 9 appears in the previous.)On average, games replace 2.9 slots with a standard deviation of 1.63, and 3.5 players with a standard deviation of 2.21.
| Player | Slot replacement rate | Player replacement rate |
|---|---|---|
| Town Newbies | 38.9% | 46.8% |
| Scum Newbies | 43.5% | 56.3% |
| Total Newbies | 39.9% | 48.9% |
| Town SEs | 24.3% | 27.0% |
| Scum SEs | 26.7% | 29.3% |
| Total SEs | 24.8% | 27.5% |
| Town ICs | 10.3% | 11.1% |
| Scum ICs | 16.4% | 16.4% |
| Total ICs | 11.8% | 12.4% |
| All town | 31.7% | 37.4% |
| All scum | 35.5% | 43.9% |
| All players | 32.6% | 38.9% |


Spoiler: Power role stats
The rate of each role living to endgame is as follows:
Interesting notes (ask for more):
| Role | Setups | Town win | Scum win | Total |
|---|---|---|---|---|
| Jailkeeper | 1 and A | 48% (71 games) | 12% (83 games) | 29% (154 games) |
| Cop | 2 and B | 51% (78 games) | 7% (83 games) | 29% (161 games) |
| Doctor | 2 and C | 51% (79 games) | 19% (80 games) | 35% (159 games) |
| Bulletproof | 3 and A | 86% (65 games) | 68% (96 games) | 75% (161 games) |
| Tracker | 3 and C | 49% (68 games) | 11% (90 games) | 27% (158 games) |
| Roleblocker | 2 and A | 0% (by definition) | 88% (86 games) | 47% (162 games) |
Interesting notes (ask for more):
- In setup 2, in scum wins, 8% of Cops get lynched Day 1, and 39% get killed Night 1, leaving only 53% alive for Day 2 (38 games)
- In setup 2, in scum wins, 18% of Doctors get killed Night 1, and 21% get killed Night 2 (38 games)
- In setup 2, in scum wins, the Roleblocker is alive at the end 92% of the time (38 games)
- In setup 3, 35% of Trackers are killed Night 2 in town wins, while 42% are killed N2 in scum wins (82 games)
- In setup 3, in scum wins, only 25% of Trackers are alive by Day 3, and 10% survive to endgame (48 games)
- In setup B, in town wins, 24% of Cops get killed Night 1, and only 48% survive to endgame (33 games)
- In setup B, in scum wins, 11% of Cops get lynched Day 1, 42% of Cops get killed Night 1, and only 16% of Cops are alive by Day 3 (45 games)
- In setup C, in scum wins, 26% of Doctors get killed Night 1 while another 50% die Night 2, leaving 17% alive for Day 3 (42 games)
Spoiler: Day 1 stats
- Town-scum-NL rate: 368-94-10 (random lynching would give 367-105-0; the difference is [0.19%]-[-2.31%]-[+2.12%])
- If town is lynched D1, they go 137-231 (37.2%)
- If scum is lynched D1, they go 17-77 (18.1%)
- If there is no lynch D1, town goes 2-8 (20.0%)
Spoiler: Lynch accuracy stats
In the following table, the first three columns are the raw percentages, while the last two are the difference between that and random (positive = more, negative = less). So when town does better than random, it has a negative in lynching town and a positive in lynching scum (random never no-lynches, so the difference is the data).
Note that, due to the way in which I store the stats, if a game has a no-lynch followed by a no-kill (two chances to lynch with the same ratio), the first one is ignored and the second one counts. As a result there's probably a slightly higher number of no-lynches than is being reported.


Note that, due to the way in which I store the stats, if a game has a no-lynch followed by a no-kill (two chances to lynch with the same ratio), the first one is ignored and the second one counts. As a result there's probably a slightly higher number of no-lynches than is being reported.
| Ratio | Town | Scum | No lynch | Town | Scum | |
|---|---|---|---|---|---|---|
| 7:2 (474 samples) | 78.7% | 19.8% | 1.5% | +0.9% | -2.4% | |
| 7:1 (30 samples) | 53.3% | 46.7% | 0.0% | -34.2% | +34.2% | |
| 6:2 (83 samples) | 55.4% | 38.6% | 6.0% | -19.6% | +13.6% | |
| 6:1 (76 samples) | 57.9% | 40.8% | 1.3% | -27.8% | +26.5% | |
| 5:2 (308 samples) | 64.6% | 33.1% | 2.3% | -6.8% | +4.5% | |
| 5:1 (68 samples) | 52.9% | 45.6% | 1.5% | -30.4% | +28.9% | |
| 4:2 (78 samples) | 38.5% | 29.5% | 32.1% | -28.2% | -3.8% | |
| 4:1 (123 samples) | 57.7% | 41.5% | 0.8% | -22.3% | +21.5% | |
| 3:2 (194 samples) | 59.8% | 38.7% | 1.5% | -0.2% | -1.3% | |
| 3:1 (77 samples) | 53.2% | 32.5% | 14.3% | -21.8% | +7.5% | |
| 2:1 (132 samples) | 53.8% | 44.7% | 1.5% | -12.9% | +11.4% |
Spoiler: Game length stats
- No games have ended with Day 1 lynch (only possible via modkills)
- No games have ended with Night 1 kill (only possible via modkills)
- Games that end with Day 2 lynch take 20.0 days with standard deviation of 5.43 (40 games)
- No games have ended with Night 2 kill (only possible via modkills)
- Games that end with Day 3 lynch take 34.6 days with standard deviation of 9.99 (196 games)
- Games that end with Night 3 kill take 39.5 days with standard deviation of 9.10 (10 games)
- Games that end with Day 4 lynch take 44.5 days with standard deviation of 12.86 (180 games)
- Games that end with Night 4 kill take 46.7 days with standard deviation of 8.16 (4 games)
- Games that end with Day 5 lynch take 49.9 days with standard deviation of 14.49 (39 games)
- One game has ended with Night 5 kill; it took 62.5 days
- Games that end with Day 6 lynch take 56.6 days with standard deviation of 10.88 (4 games)
- No games have ended with Night 6 kill
- One game has ended with Day 7 lynch; it took 84.0 days
- Overall, games take 39.0 days with standard deviation of 13.92; the vast majority of games end with a Day 3 or Day 4 lynch (79.16%), with Day 2 and Day 5 lynches being tied for second-most common (16.63%)
Spoiler: Replacement vs. length stats
- When 0 slots are replaced all game, games take 27.9 days with standard deviation of 11.86 (24 games)
- When 1 slot is replaced all game, games take 34.3 days with standard deviation of 12.81 (76 games)
- When 2 slots are replaced all game, games take 35.5 days with standard deviation of 12.23 (102 games)
- When 3 slots are replaced all game, games take 38.4 days with standard deviation of 13.26 (103 games)
- When 4 slots are replaced all game, games take 44.2 days with standard deviation of 14.43 (84 games)
- When 5 slots are replaced all game, games take 44.2 days with standard deviation of 12.34 (58 games)
- When 6 slots are replaced all game, games take 47.6 days with standard deviation of 12.35 (20 games)
- When 7 slots are replaced all game, games take 50.1 days with standard deviation of 14.57 (7 games)
- One game replaced 8 slots; it took 71.5 days
- No games have had 9 slots replaced
- When 0 players are replaced all game, games take 27.9 days with standard deviation of 11.86 (24 games)
- When 1 player is replaced all game, games take 33.8 days with standard deviation of 12.87 (66 games)
- When 2 players are replaced all game, games take 34.9 days with standard deviation of 12.62 (85 games)
- When 3 players are replaced all game, games take 37.0 days with standard deviation of 11.83 (89 games)
- When 4 players are replaced all game, games take 41.0 days with standard deviation of 14.41 (78 games)
- When 5 players are replaced all game, games take 42.7 days with standard deviation of 12.99 (48 games)
- When 6 players are replaced all game, games take 46.3 days with standard deviation of 12.54 (37 games)
- When 7 players are replaced all game, games take 45.3 days with standard deviation of 11.13 (22 games)
- When 8 players are replaced all game, games take 54.4 days with standard deviation of 9.85 (14 games)
- When 9 players are replaced all game, games take 56.5 days with standard deviation of 16.49 (4 games)
- When 10 players are replaced all game, games take 50.9 days with standard deviation of 14.19 (6 games)
- When 11 players are replaced all game, games take 51.1 days with standard deviation of 28.88 (2 games)
- No games have had more than 11 players replaced
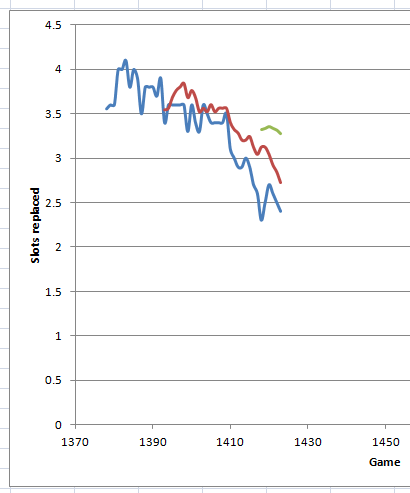
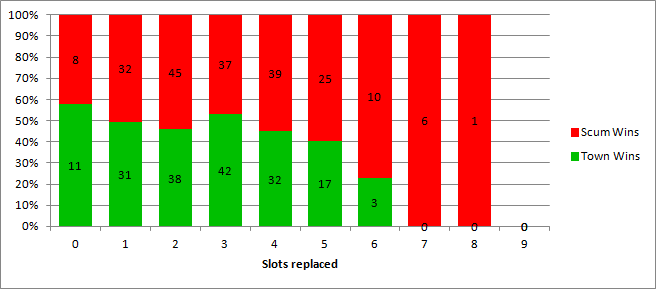
Spoiler: Replacement vs. winrate stats
For slots:
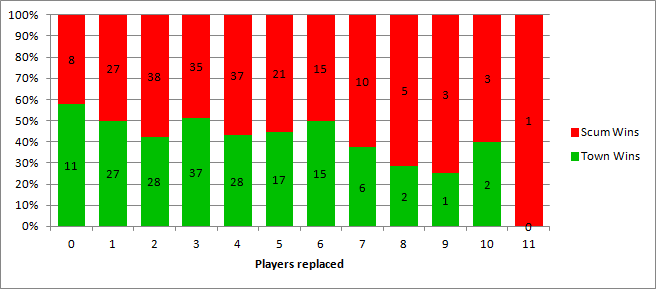
For players:
- When 0 slots are replaced all game, town goes 13-11 (54.2%)
- When 1 slot is replaced all game, town goes 40-36 (52.6%)
- When 2 slots are replaced all game, town goes 48-54 (47.1%)
- When 3 slots are replaced all game, town goes 51-52 (49.5%)
- When 4 slots are replaced all game, town goes 41-43 (48.8%)
- When 5 slots are replaced all game, town goes 21-36 (36.8%)
- When 6 slots are replaced all game, town goes 3-16 (15.8%)
- When 7 slots are replaced all game, town goes 0-7 (0.0%)
- When 8 slots are replaced all game, town goes 0-1 (0.0%)
- No games have had 9 slots replaced
For players:
- When 0 players are replaced all game, town goes 13-11 (54.2%)
- When 1 player is replaced all game, town goes 35-31 (53.0%)
- When 2 players are replaced all game, town goes 39-46 (45.9%)
- When 3 players are replaced all game, town goes 43-46 (48.3%)
- When 4 players are replaced all game, town goes 34-44 (43.6%)
- When 5 players are replaced all game, town goes 22-26 (45.8%)
- When 6 players are replaced all game, town goes 17-20 (45.9%)
- When 7 players are replaced all game, town goes 7-14 (33.3%)
- When 8 players are replaced all game, town goes 4-9 (30.8%)
- When 9 players are replaced all game, town goes 1-3 (25.0%)
- When 10 players are replaced all game, town goes 2-4 (33.3%)
- When 11 players are replaced all game, town goes 0-2 (0.0%)
- No games have had more than 11 players replaced
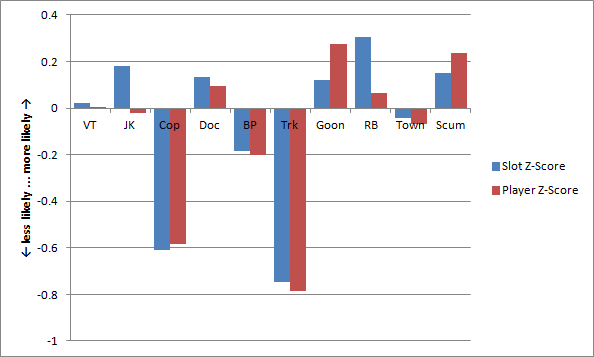
Spoiler: Replacement vs. role stats
| Role | Slots | Slots replaced | Players replaced |
|---|---|---|---|
| Vanilla Townie | 2528 | 33.0% | 39.2% |
| Jailkeeper | 156 | 31.4% | 33.3% |
| Cop | 161 | 20.5% | 24.2% |
| Doctor | 159 | 33.3% | 39.6% |
| 1-Shot Bulletproof | 163 | 30.1% | 35.6% |
| Tracker | 158 | 22.8% | 25.9% |
| Mafia Goon | 786 | 34.7% | 44.4% |
| Mafia Roleblocker | 164 | 39.0% | 41.5% |

Spoiler: Perfect win stats
- Out of 217 town wins, 40 wins (18.4%) involved only scum lynches.
- 26 wins (12.0%) were semi-perfect (no town lynches).
- 14 wins (6.5%) were perfect (no town deaths).
- Out of 256 scum wins, 146 wins (57.0%) were perfect (no scum deaths).
Notes
- For any stat that counts wins and losses, draws are ignored.
- The replacement stats recorded here are likely lower than in reality, as replacements are not recorded if the player never confirmed, or the player was force-replaced due to a mod error or something similar that was not the replaced player's fault. If a player posts in any way (or has been acknowledged by the mod as having confirmed/read their role PM), or gets themselves force-replaced (such as getting banned), replacing them counts.
- Slot-based stats might be a bit off due to cases where slots "level up" via replacement (e.g. an experienced player replaces into a newbie slot).
- Players are assumed to have won regardless of modkills (unnecessary complication).
- Only notable and requested PR stats are listed. Ask for one to get it added.
If you'd like to know something that isn't here, I'll see what I can do.